
Hummingbird Ice 55 Flasher
As a lifelong commercial fisherman and engineer, I have always tried to use the tools at hand to improve my harvest. Many spring tides ago, I remember looking at a flasher and thinking it was amazing that it could see below the boat, but it took several years of trial and error experience to interpret all of the information on the dial. Fast forward several decades and it's possible to still buy a flasher, complete with colored lights, but how to understand what a fish finder is displaying is one of most often asked questions I get.
Some of the latest developments in echo locating fish include broadband transmission, higher frequency emissions, and modified transducer element shapes. Some of the imaging is incredible and can provide picture like quality making finding fish as easy as looking at a photo. Physics limitations still apply, so understanding the physical characteristics of the transducer and how sound waves are effected by water play the most significant role in using these devices.
While fishing for salmon I grabbed some screenshots that demonstrate some of the nuances in interpreting what is below the surface.

Furuno DFF1 with Airmar B260 1kW transducer, 50/200kHz, 20/6 degrees
Looking at the screenshot above, note the low frequency 50kHz is displayed on the left and a high frequency 200kHz image on the right. We know that lower frequencies go deeper in the water column, while higher frequencies will give more resolution, or detail, further defining an echo return. There is another important characteristic of the transducer at play; beam angle.
On the LF image to the left, the width of the beam from that element covers 53' of the ocean floor while the HF image on the right only covers 16'. Now I can see that the bait ball is off to the side of the boat, at least 16'
There is still more information to be had. There are some good returns near the surface, where salmon are between 20-30 feet of water. At this depth, the LF image covers 11' while the HF image covers 3' and represents fish directly below the transducer in 30' of water. This is an excellent example of why displaying both frequencies at the same time can give you that extra advantage. If only relying on the HF image, I may choose to move from this location, but the wider beam angle from the LF element shows me there is more going on just around the boat. We caught a bunch of fish.
There are now transducers available that offer a wide beam angle in the higher frequencies. That allows for a display that is scaled correctly for different frequencies, at the expense of not knowing if the target was directly below the boat, or further off to one side. It does, however allow the comparison of different frequencies on the same target that can convey further information, such as species or size.
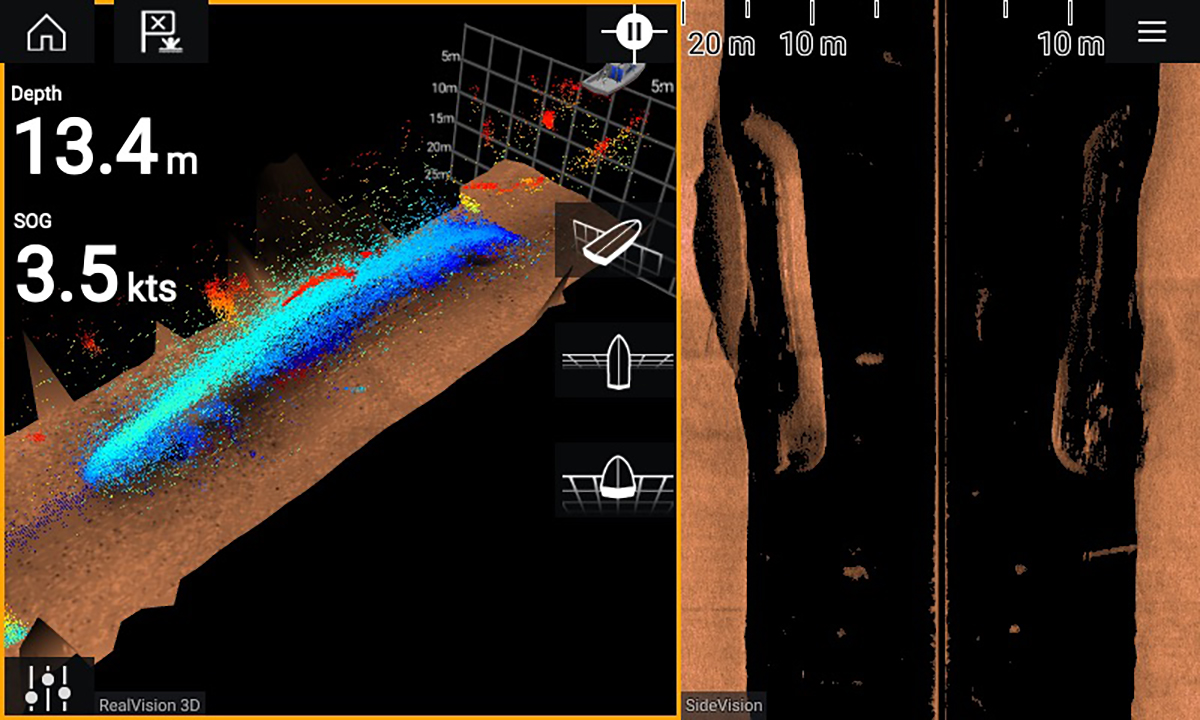
Raymarine Axiom RealVision
Now I'm looking forward to phased array elements that allow for precise azimuth and bearing to a target. We can see the beginning of this development with products like the Raymarine Axiom using the RV100 transducer.
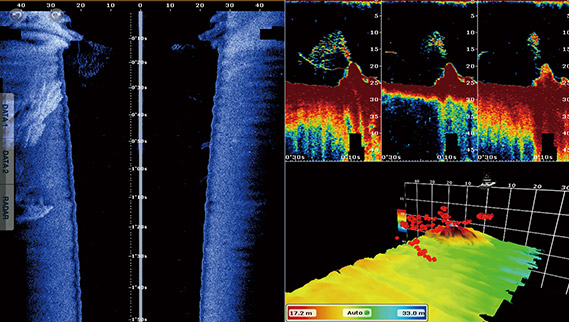
Furuno DFF3D displayed on TZT MFD
Not to be outdone, Furuno is also in the sidescan 3D business and offers hardware solutions that get down to 350m using the DFF3D and TM54 or B54 transducer operating in the 160kHz range.
Any way you look at it fish finders have come quite a ways since the days of the humble flasher.
Capt. Brett